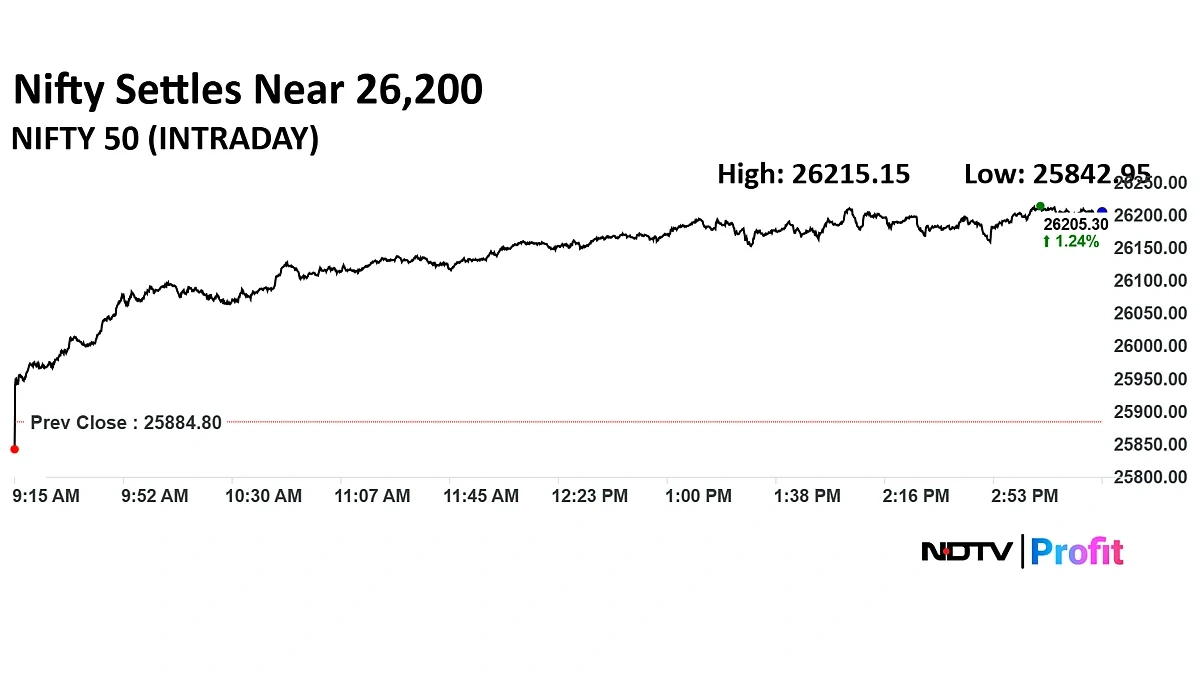
The Nifty 50 has been flirting with the 26,000 mark like a shy teenager at prom. It gets close, pulls away, tries again… and repeat. But why is this particular level proving to be such an impenetrable wall? It’s not just a number; it’s a psychological barrier, a technical challenge, and a whole lot more. Here’s the thing: understanding why this happens can give us serious insights into the market’s current mood and potential future moves.
The Psychology of Round Numbers
Let’s be honest, round numbers like 26,000 aren’t magical. They don’t hold intrinsic powers. But human brains love them. They’re easy to remember, they act as anchors, and they often become self-fulfilling prophecies. Traders, both big and small, tend to place buy or sell orders around these levels, creating a sort of gravitational pull. Think of it like this: if everyone expects a level to be tough, it becomes tough, simply because everyone’s watching it. This is where the power of herd mentality truly kicks in.
But it goes deeper than just simple psychology. Consider the options market. A significant number of call options might be written with strike prices near 26,000. This creates a massive wall of potential sellers (option writers) who will actively defend that level to avoid their options going into the money. As per the guidelines mentioned in the information bulletin, option writers often employ sophisticated hedging strategies, further reinforcing the resistance.
Now, what does it mean for you? Don’t just blindly follow the herd. Understand why these levels matter. A common mistake I see people make is treating round numbers as absolute ceilings or floors. They’re not. They’re areas of heightened activity where a battle between bulls and bears is likely to play out. Keep a close eye on the market breadth and volume, not just the index level itself.
Technical Resistance and Trendlines
Beyond the psychological aspect, 26,000 may also align with significant technical resistance levels. We’re talking about long-term trendlines, Fibonacci retracement levels, or even the upper band of a channel pattern. Chart readers, the world over, will be keenly observing these. Remember, technical analysis isn’t about predicting the future (no one can do that consistently!). It’s about identifying potential areas of support and resistance based on past price action.
I initially thought this was straightforward, but then I realized how many different ways technical analysts can interpret the same chart! What fascinates me is how subjective it can be. One analyst might see a clear breakout pattern forming, while another sees a head-and-shoulders pattern signaling a reversal. The key? Don’t rely solely on one indicator or one analyst’s opinion. Diversify your sources and develop your own critical eye.
What is the breakoutthat everyone is talking about? The truth is, market is struggling with momentum. And this is the biggest reason for the Nifty 50’s struggle.
Global Cues and Macroeconomic Factors
The Indian stock market doesn’t exist in a vacuum. It’s heavily influenced by global cues, macroeconomic factors, and the overall sentiment of foreign institutional investors (FIIs). A sudden downturn in the US market, rising interest rates, or geopolitical tensions can all trigger a sell-off, regardless of how strong the domestic fundamentals might be. So, while you’re busy analyzing the Nifty 50 index chart, don’t forget to keep an eye on the bigger picture.
Let me rephrase that for clarity: It’s not enough to just focus on domestic news. You need to understand how global events impact investor sentiment and capital flows. The one thing you absolutely must double-check is the FII investment trends. Are they net buyers or sellers? Their actions can often amplify market movements, especially around key resistance levels. Remember that global markets can impact the market cap significantly.
And that’s why understanding these global factors is so important for long term investments. Consider the impact of rising crude oil prices on the Indian economy – a major importer. Higher oil prices can fuel inflation, put pressure on the rupee, and ultimately dampen corporate earnings. These factors can all contribute to the Nifty 50 failing to break through resistance.
Earnings Season and Corporate Performance
The quarterly earnings season is a critical period for the stock market. If major companies within the Nifty 50 fail to meet expectations, it can trigger a broad-based correction. Investors become jittery, selling pressure increases, and that 26,000 level suddenly looks even more distant. On the other hand, a strong earnings season can provide the necessary fuel for a sustained breakout.
But, here’s the catch. Earnings aren’t everything. Smart investors look beyond the headline numbers and delve into the underlying trends. Are revenue growth rates accelerating or decelerating? Are margins improving or deteriorating? What’s the management’s outlook for the next quarter? These are the questions that truly matter.
And it’s not just about individual company performance; it’s about the overall sector trends. A common mistake I see people make is extrapolating the performance of one company to the entire sector. The IT sector performance is dependent on USDINR rate. This can provide a competitive edge to some companies and not to others.
Market Sentiment and Investor Positioning
Finally, let’s talk about market sentiment and investor positioning. If everyone’s already bullish and fully invested, there’s simply not enough buying power left to push the index through a major resistance level. Conversely, if sentiment is overly bearish, a positive surprise can trigger a sharp rally.
What fascinates me is how quickly market sentiment can change. One day everyone’s predicting a crash, the next day they’re talking about a new bull market. This is where contrarian investing comes into play. As contrarian investors, we need to determine the general trend and sentiments of the investors, so that we can make profits by investing against them.
According to the latest circular on the official NSE website ( nseindia.com ), analyzing open interest data, put-call ratios, and media sentiment can provide valuable insights into the prevailing market mood. Remember, the market often does the opposite of what the majority expects. Don’t just follow the crowd; think for yourself.
So, why is 26,000 such a tough level to break for the Nifty 50 ? It’s a combination of psychological factors, technical resistance, global cues, earnings performance, and market sentiment. Understanding these dynamics is crucial for navigating the market and making informed investment decisions. Remember, investing is a marathon, not a sprint. Stay patient, stay disciplined, and stay curious.
FAQ Section
What if the Nifty 50 doesn’t break 26,000?
A prolonged period of consolidation below 26,000 could indicate a potential correction. Be prepared to reduce your equity exposure and protect your profits.
How do I know if a breakout is genuine?
Look for a breakout accompanied by high volume and strong momentum. A fake breakout will often be followed by a quick reversal.
Should I buy Nifty 50 when it hits 26,000?
It depends on your risk tolerance and investment horizon. Consider your individual circumstances before making any investment decisions.
What are the key factors to watch for the next few weeks?
Keep an eye on global interest rate decisions, upcoming earnings announcements, and FII flows.
How to calculate market capitalization of a stock in nifty 50?
Market capitalization is calculated by multiplying the total number of outstanding shares with the price of each share.
What are the key resistance levels of nifty 50?
The immediate resistance levels are 26,100, 26,200 and 26,300. You should also check the stock recommendations on our website before investing.
The Nifty 50’s struggle isn’t just a statistic; it’s a constant lesson in market dynamics. It teaches us that investing is less about predicting the future and more about understanding the present. Keep learning, keep adapting, and you’ll be well on your way to investment success. And remember, you can view short term stock gains at LSL Marketing . Also, one should know about rupee value plummets before taking investment decisions.


Leave feedback about this